[Python library] Matplotlib 101
Fall 2023
Junehyung Lee
Installing the python library
To install the python library, matplotlib, type below line to your terminal.
python -m pip install matplotlib
Loading the library and initiating an empty figure in matplotlib
To load the installed python libary: (include this line before use plt in the script)
import matplotlib.pyplot as plt
To initiate an empty figure with single ax and a size of 8" x 6":
fig, ax = plt.subplots(figsize=(8, 6))
To initiate an empty figure with multiple axes
(e.g., 6 axes with 2 x 3 layout):
fig, axes = plt.subplots(nrows=2, ncols=3, figsize=(8, 6))
Types of plots that are useful in matplotlib
Examples
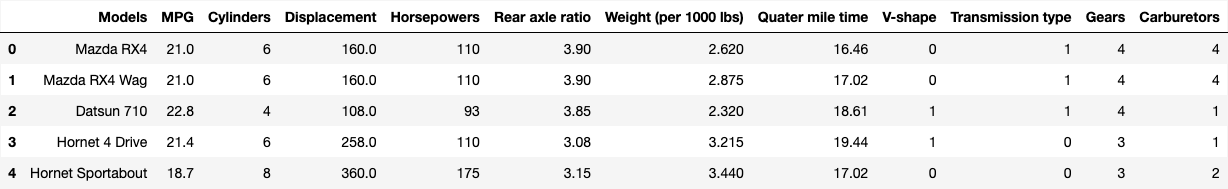
"mtcars" dataset has been used for the following examples. The dataset also can be obtained at this url.
            import pandas as pd


            data = pd.read_csv('mtcars.csv')
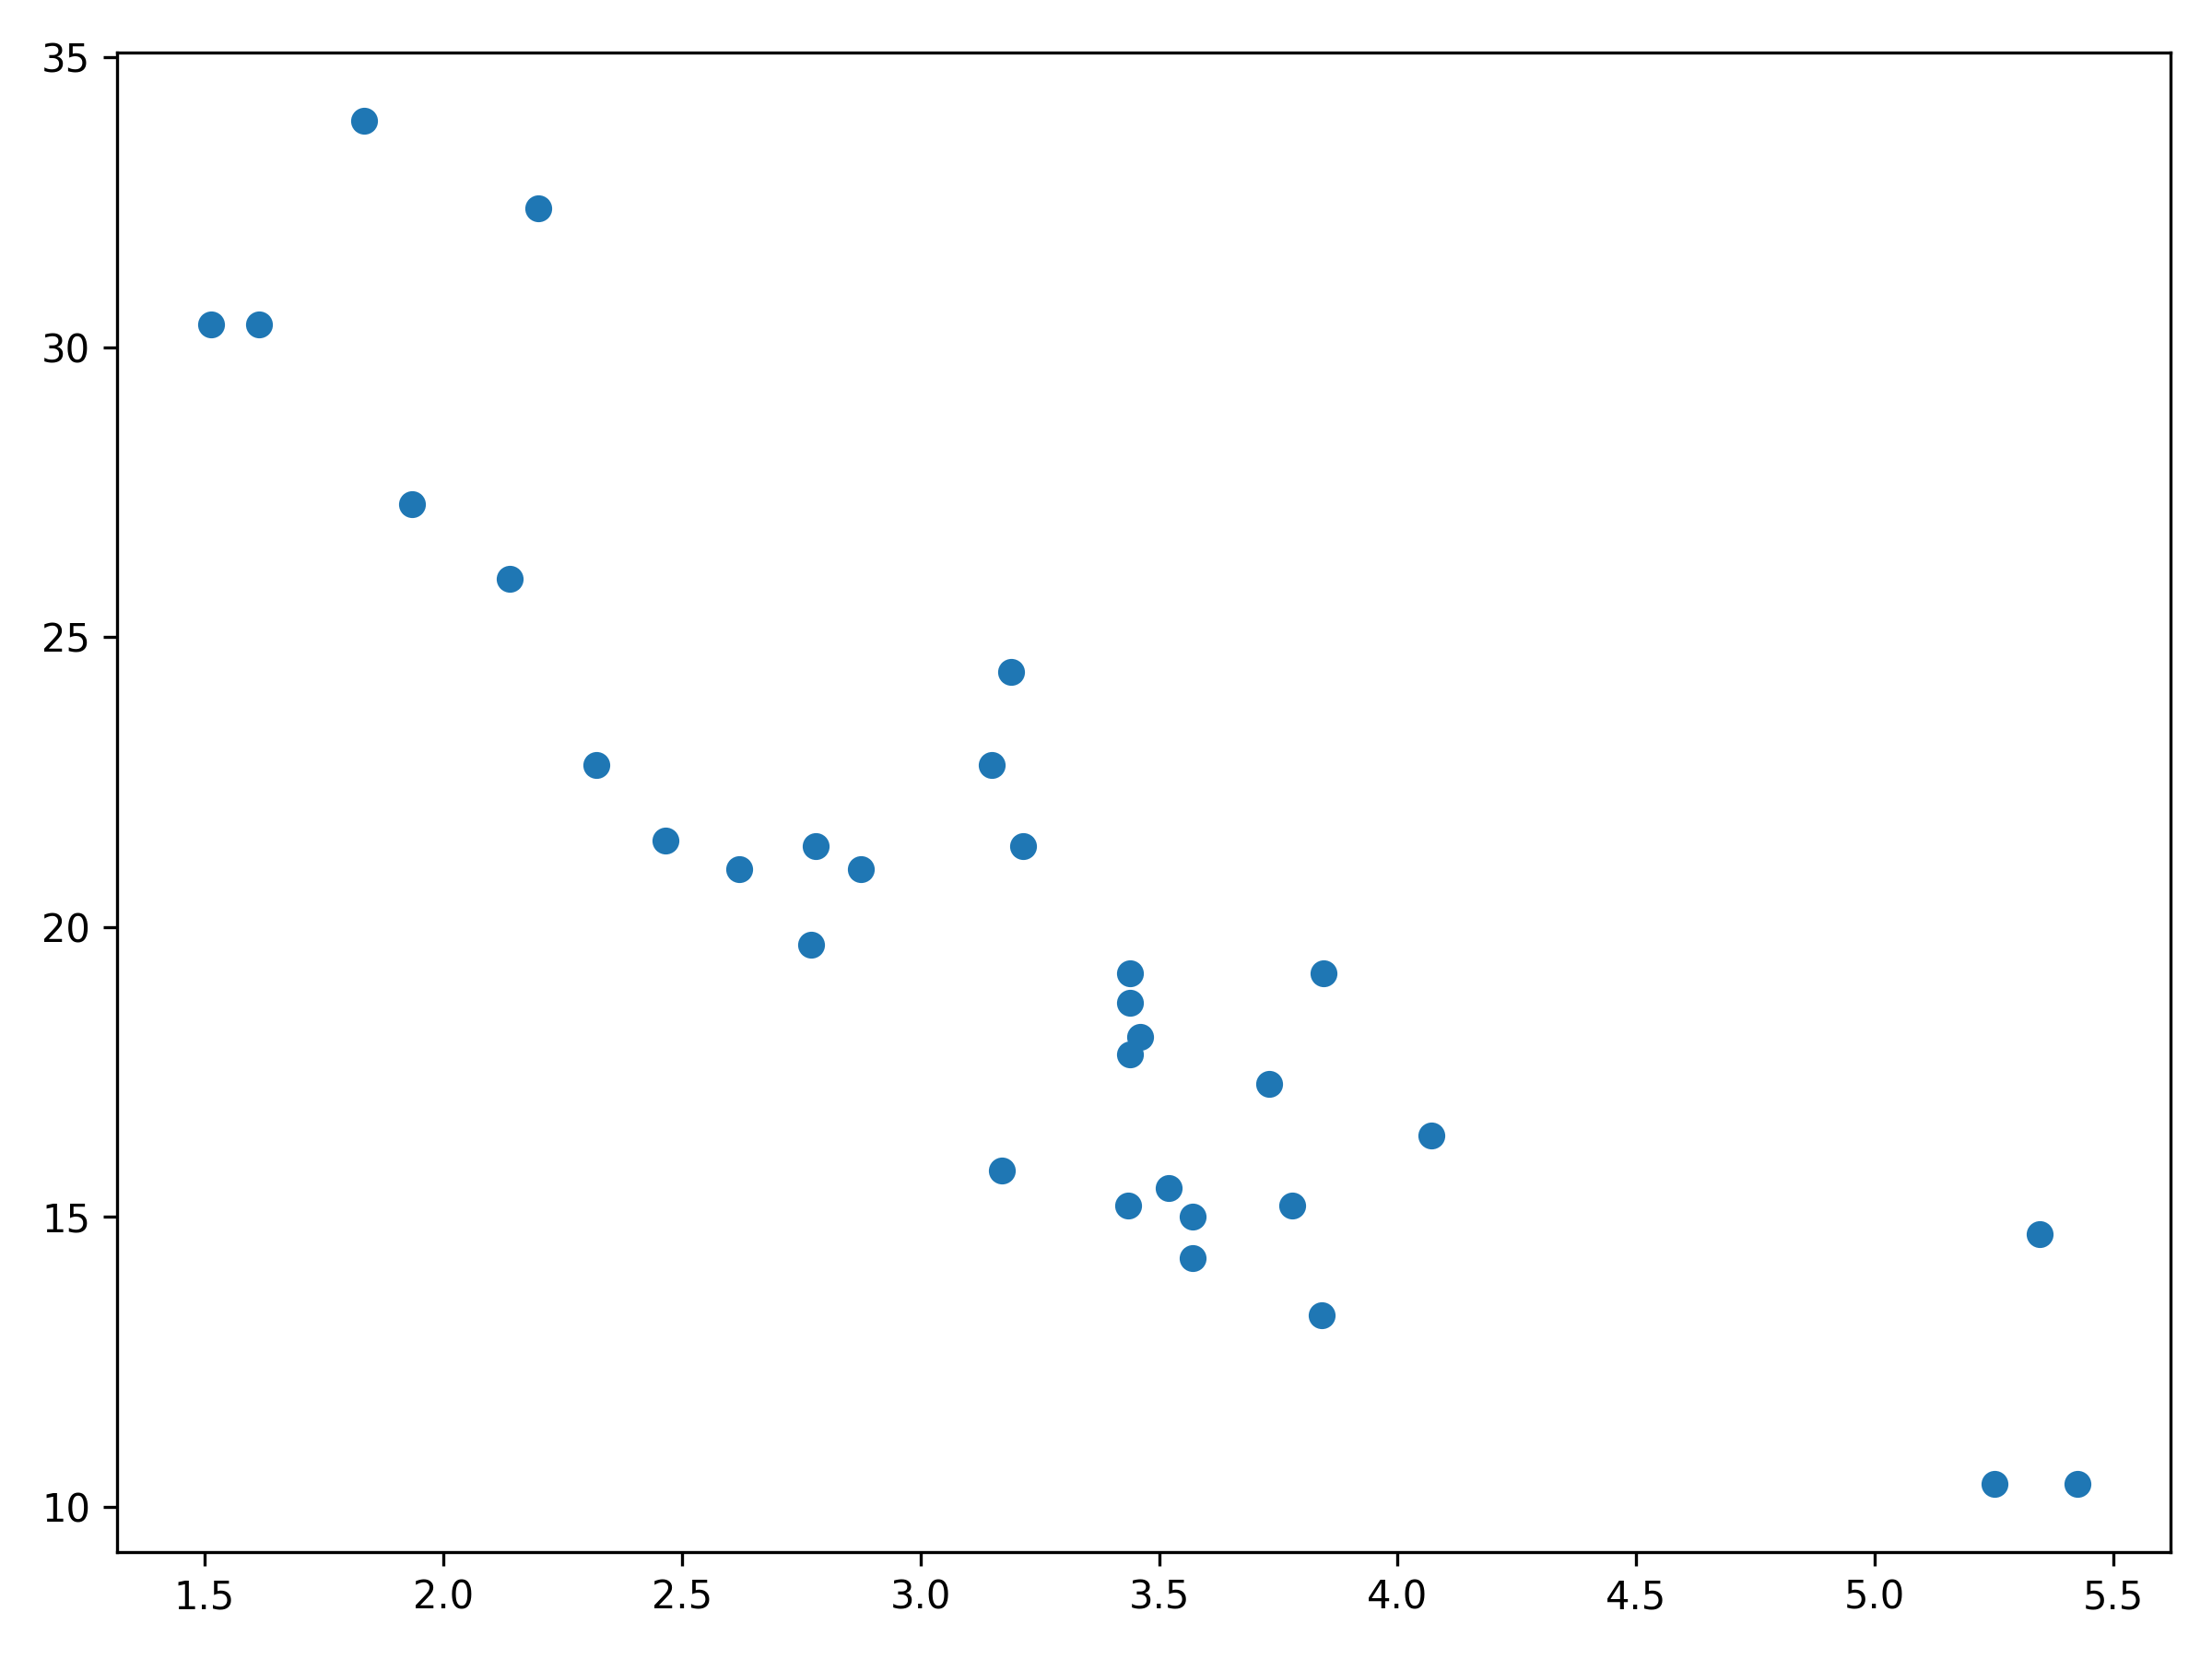
Matplotlib scatter
                import matplotlib.pyplot as plt


                fig, ax = plt.subplots(figsize=(8, 6))


                ax.scatter(x=data['Weight'], y=data['MPG'])


                plt.tight_layout()

                plt.show()


                plt.savefig('mtcars-wt_mpg.png', dpi=300)


                plt.close()         # Run this line to close the plot.
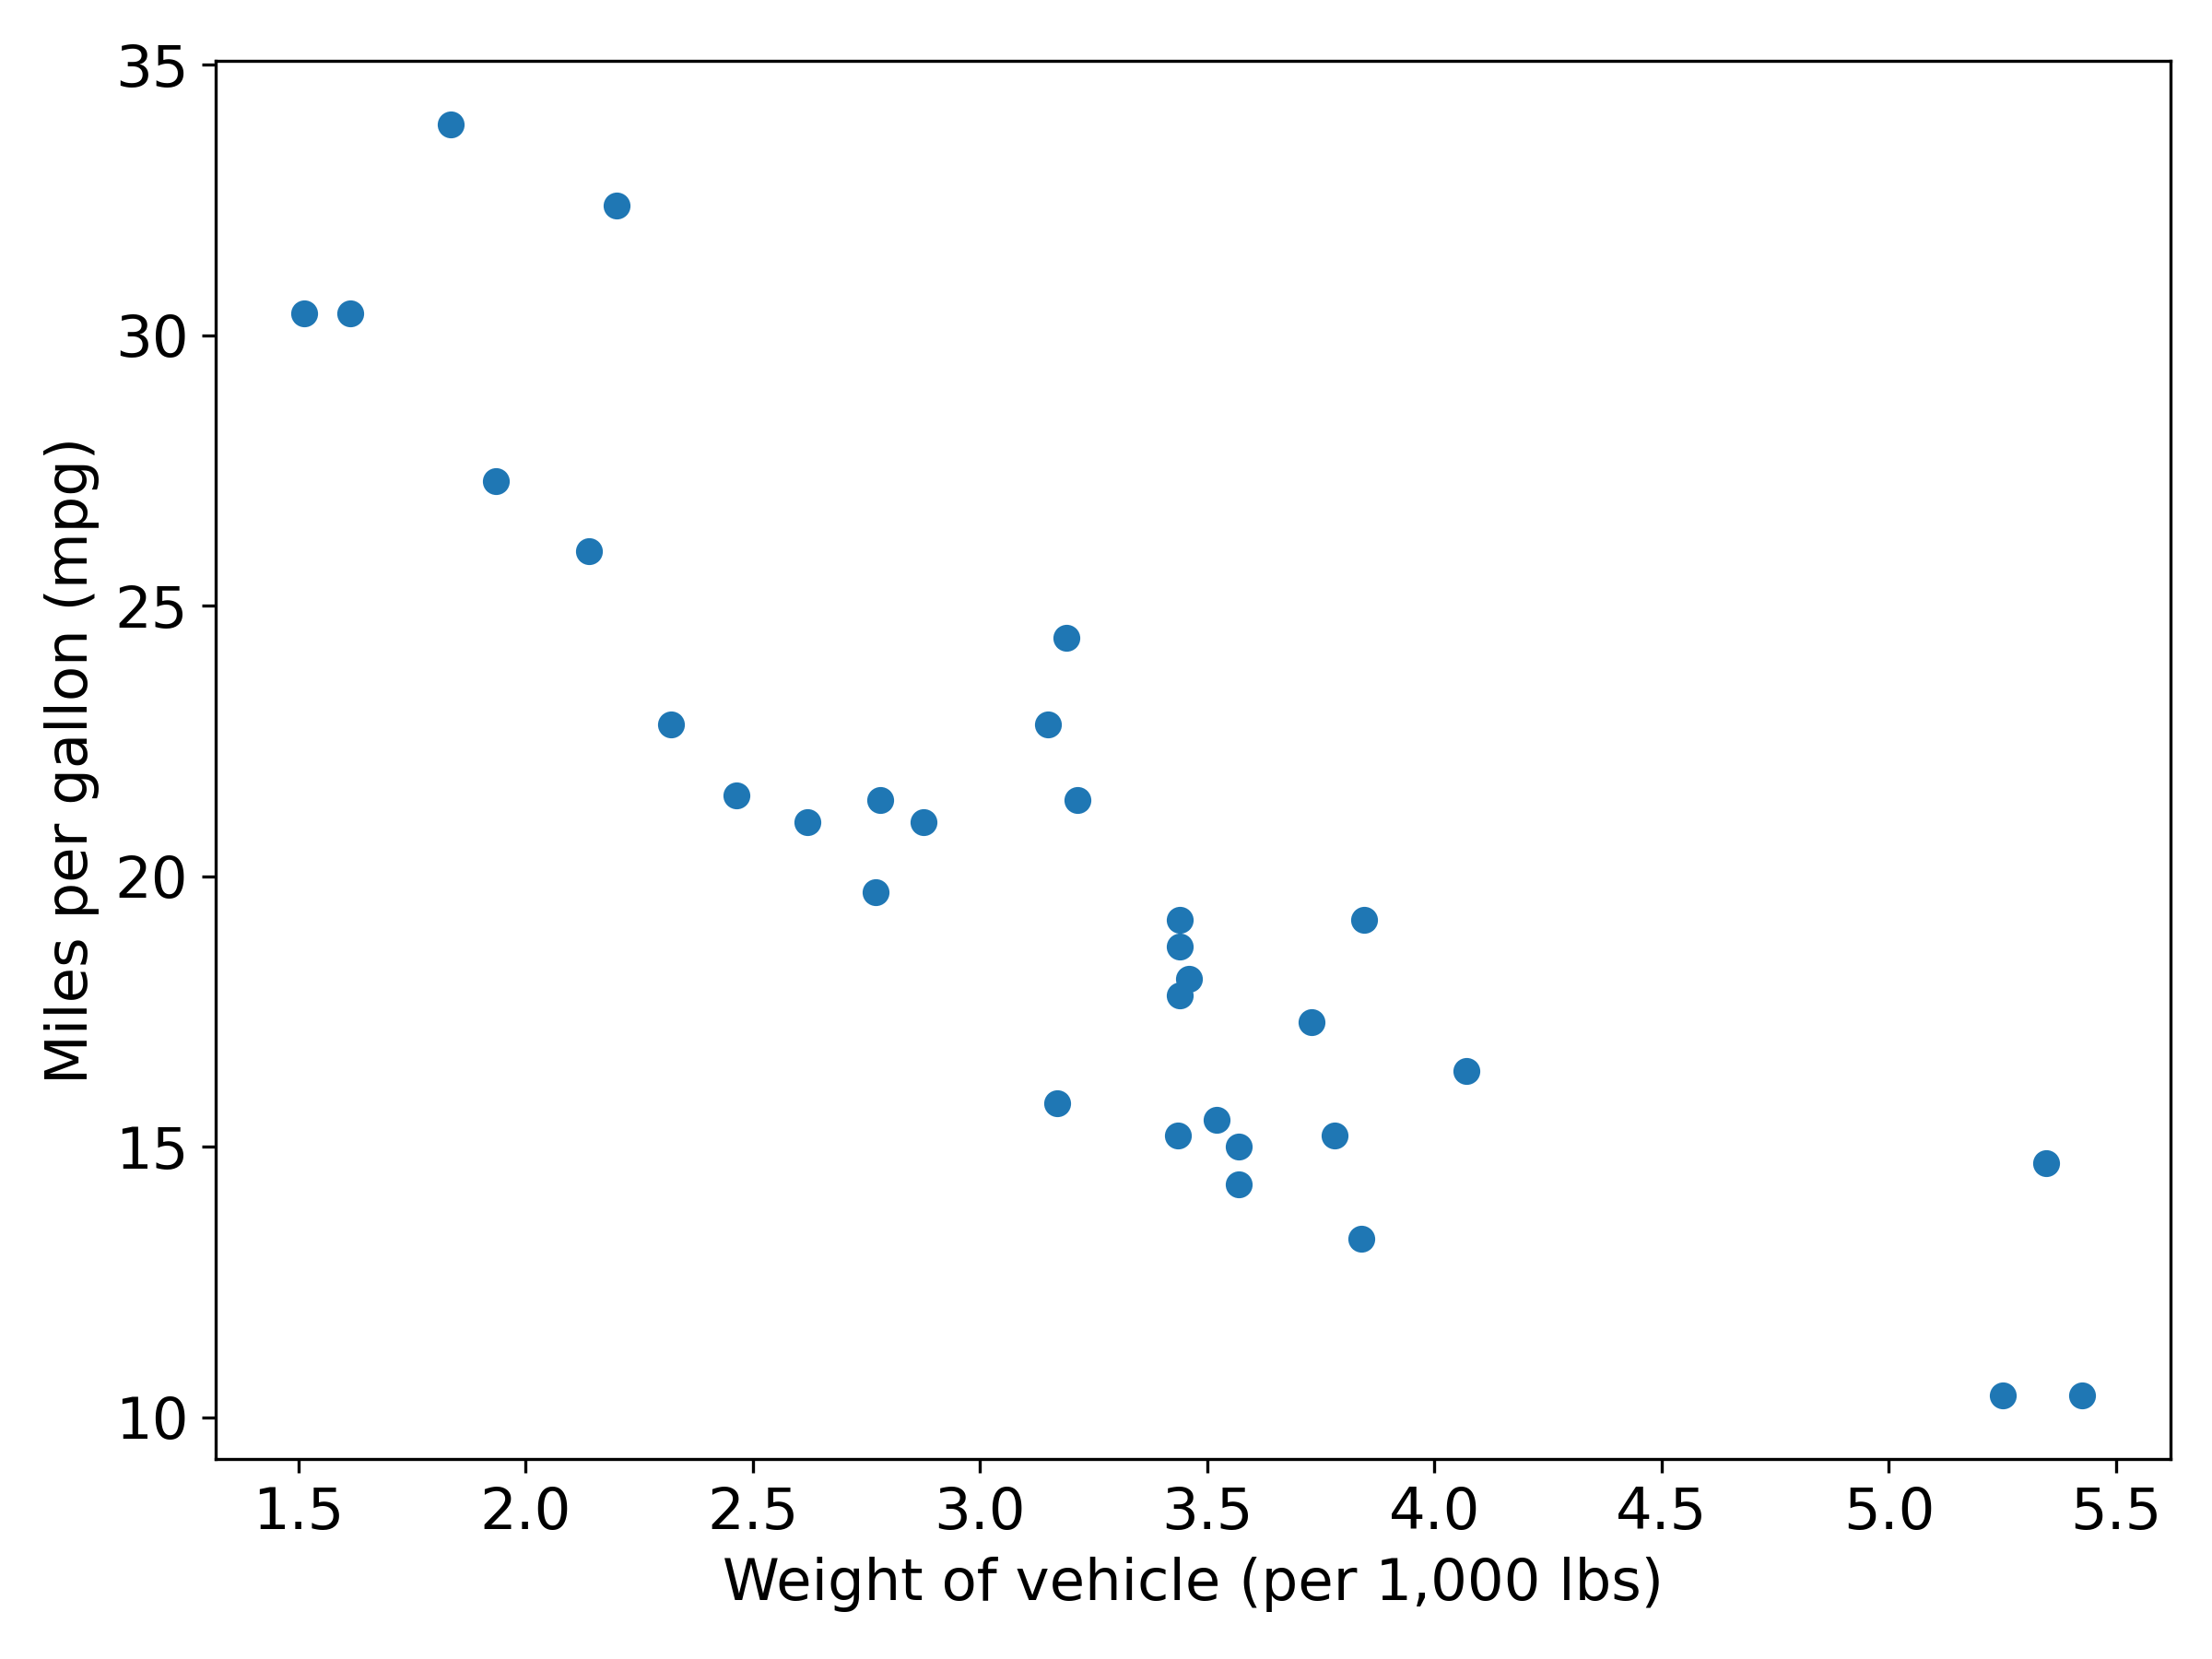
Adding labels for x-axis and y-axis
                import matplotlib.pyplot as plt


                fig, ax = plt.subplots(figsize=(8, 3))


                ax.scatter(x=data['Weight'], y=data['MPG'])


                ax.set_xlabel('Weight of vehicle (per 1,000 lbs)')

                ax.set_ylabel('Milers per gallon (mpg)')


                ax.tick_params(axis='both', labelsize=15)


                plt.tight_layout()

                plt.show()


                plt.savefig('mtcars-wt_mpg-with labels.png', dpi=300)
Plotting them in different colors
Let's say we want to plot them in differnet colors based on whether its engine is V-shape or not.
                import matplotlib.pyplot as plt


                fig, ax = plt.subplots(figsize=(8, 3))


                ax.scatter(x=data['Weight'], y=data['MPG'], label=data['V-shape'])


                ax.set_xlabel('Weight of vehicle (per 1,000 lbs)')

                ax.set_ylabel('Milers per gallon (mpg)')


                ax.tick_params(axis='both', labelsize=15)


                plt.tight_layout()

                plt.show()


                plt.savefig('mtcars-wt_mpg-with labels.png', dpi=300)
